WYSIWYG (“What You See Is What You Get”) is very common terminology used in software. In the asset management arena, this should be changed to, ‘What You See Helps What You Get’, meaning, the more visibility you have about your assets, the better accuracy, insights, and utilization you will achieve.
Data is an integral part of every business. What distinguishes the most successful businesses is the ability to manage, share, and clearly and rapidly communicate essential information across the enterprise. Visualizing data in the clearest ways possible, helps business leaders make informed decisions and take proactive actions.
Visualizing Data
Which data visualizations to use depends on the data available and the types of information to be communicated to various audiences. All data visualizations help deliver one or more types of information: hindsight, oversight, insight, or foresight. As discussed in one of the earlier blogs, Predictive & Prescriptive Analytics with Visi-Trac, data analytics can be broadly categorized as descriptive, diagnostic, predictive, or prescriptive.
Different types of visualizations are best suited to provide different types of insight:
- Hindsight – requires Descriptive Analytics to answer “what happened”
- Insight – needs Diagnostic Analytics to explain “why did it happen?”
- Oversight – gained through Predictive Analytics which address “what to do and what could happen?”
- Foresight – intuited from Prescriptive Analytics which show “how can we make it happen or not?”
Data visibility need not be confined to specific roles in an organization but can be beneficial to everyone in an organization. Whether C Suite executives, managers, field engineers, or end users, visibility enables everyone to better manage or perform their roles in an organization.
- Asset management executives need appropriate analytics to protect the investment and lengthen the lifespan of assets under their control, as well as optimize asset utilization.
- Managers need data visualizations to show real-time activities which will allow them to optimize daily operations and resources.
- Field Engineers and End Users need data to easily track a company’s assets, perform service maintenance, and be more productive.
For projects related to asset management, asset utilization, or asset disposition, data becomes even more important. The greater the average asset utilization, the better the ROI on those assets. However, assessing asset utilization becomes challenging the larger the number of assets an organization owns and manages. Remembering that “What You See Helps What You Get” is where data visualization comes in handy.
For organizations with global operations, it can be challenging to view key metrics without an integrated, enterprise-wide view. For example, if a company has hundreds of locations where equipment or infrastructure has been deployed, a manager needs to know the status of all locations and instantly see where equipment or devices have problems. Simple color coding of the status by location can do the magic.
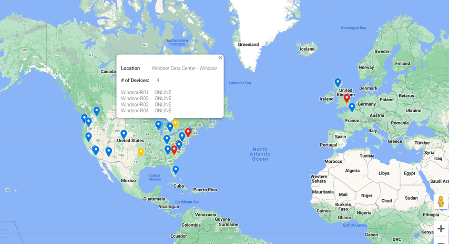
In the above image, locations are marked with red, yellow, or blue icons, depending on the status of equipment in that location. Sites where all equipment is operating correctly are marked with a blue location marker; when equipment breaks down or network issues occur, the location marker changes to yellow; and when equipment goes down or offline, the location marker changes to red. In the above visualization, it’s simple to instantly see status changes when issues arise in far-flung operations. Another view of asset utilization metrics is shown in the image below.
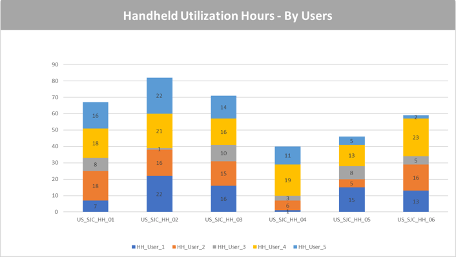
This visual shows device utilization by user by number of hours, in a stacked bar graph, providing easy usage metrics.
If your organization needs assistance with improving inventory management and asset utilization, please reach out to the RFID Global Data Analytics team at info@rfidgs.com. We will help craft the right data visualizations so that “What You See Helps What You Get”.
Very informative
Thank You!
This article provides a clear and insightful perspective on the importance of data visualization in asset management.
RFID Tag
RFID Tags